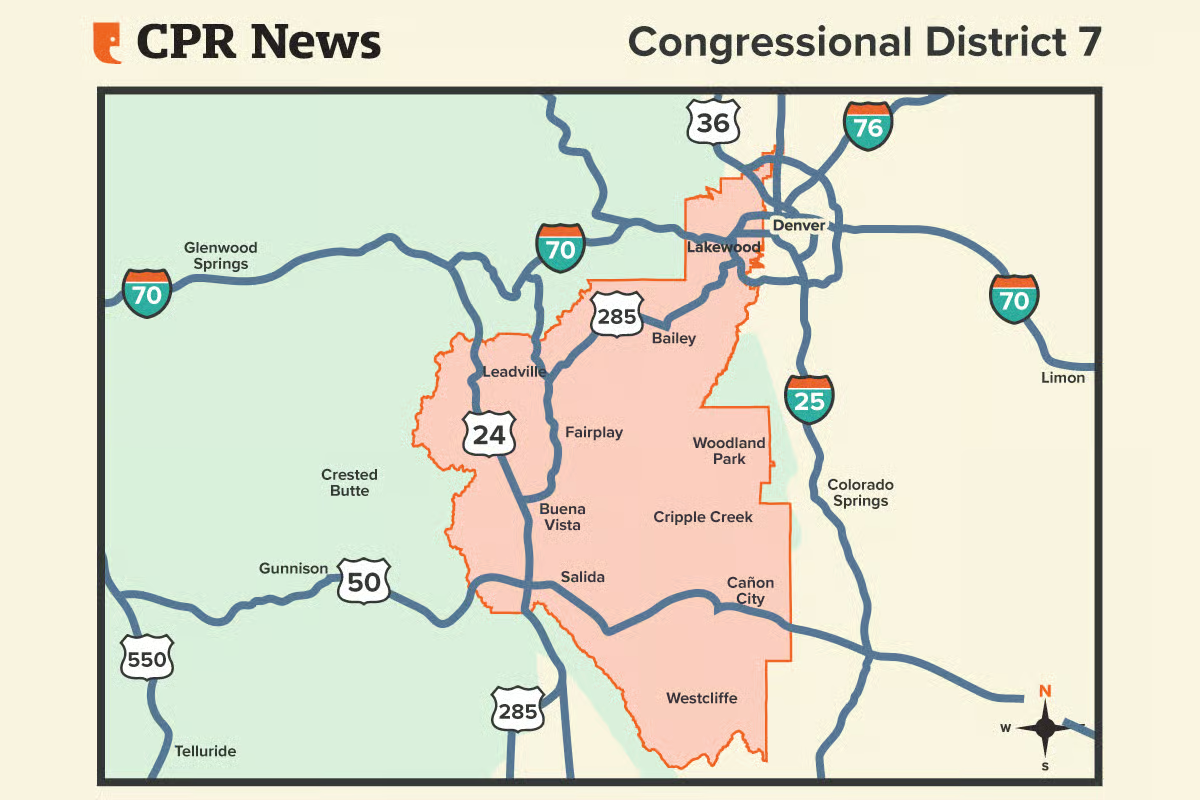
Colorado’s 7th Congressional District is a geographically diverse and economically vital region that spans both the bustling western suburbs of the Denver metropolitan area and the rugged, rural heart of the Rocky Mountains. This unique composition blends densely populated urban centers like Lakewood, Arvada, and Golden with historic mining towns and vast agricultural lands. As of 2026, the district is represented by Democrat Brittany Pettersen.
Economically, the district is anchored by a high concentration of professional, scientific, and technical services, largely driven by the presence of federal hubs like the Denver Federal Center and the National Renewable Energy Laboratory (NREL) in Golden. This professional base contributes to a median household income that exceeds $100,000, well above the national average, yet affordability remains an issue due to the high cost-of-living in the district. In addition to this suburban wealth, the district’s southern and western reaches rely heavily on tourism, outdoor recreation, and agriculture, creating a complex political dynamic.
Demographically, the 7th District is a predominantly White, middle-class region with a significant and growing Hispanic presence. As of 2024, the district’s total population is approximately 728,000, with an ethnic makeup that is roughly 79% White, 15% Hispanic or Latino, 3% Asian, and 1.4% Black, with the remainder identifying as multiracial or other ethnicities. Politically, the district is characterized by a high number of unaffiliated voters who make up 46% of the electorate, a trend common across Colorado, yet Democratic candidates remain heavily favored with only 27.6% of the registered voters.
The diversity of the 7th Congressional District’s landscape requires a representative who can balance the environmental and infrastructure needs of the high country with the suburban affordability and cost-of-living concerns of the Front Range while appealing to the large independent majority.
| Affiliation | Voters | Percent |
|---|---|---|
| Democrat | 139,834 | 27.6% |
| Republican | 124,812 | 24.6% |
| Minor Party | 9,008 | 1.8% |
| Independent | 233,201 | 46.0% |
| Race | Percent |
|---|---|
| White | 79.1% |
| Asian | 3.2% |
| Black or African American | 1.4% |
| American Indian/Alaskan Native | 1.1% |
| Native Hawaiian/Pacific Islander | 0.1% |
| Some Other Race | 4.7% |
| Multiracial | 10.4% |